What $5,000 buys you on Thumbtack - A Detailed Dive into the Data

My business recently reached a milestone, having spent $5007.99 over our time on Thumbtack.
I have collected 2.3MB of data for my business as a whole on all customers from all sources during this time and I wanted to publish my analysis on Thumbtack interactions in hopes that it can help other Thumbtack Pros' businesses be successful.
Over the next several days, I will be updating this thread with explanations, charts, graphs and other insights.
I hope Thumbtack sees the value in this effort and perhaps even makes this thread a sticky as every Pro can benefit from this information.
As with everything, your results may vary, I highly encourage anyone running a business to track every datapoint Thumbtack shows you, not only how many inquiries and cost, wins vs. losses; but even as granular as the accuracy of the inquiry. (Real example: someone requesting "five cabinet installation" when he wants one cabinet door re-installed.)
In the past, I have worked with systems generating millions of data points per day. I am not a Data Engineer, but I have enough experience to handle a system that generates less than 10 data points per day and produce relevant charts, graphs and reports.
TLDR; I spent $5007.99 on Thumbtack, earned $32,078.25 in Gross Revenue, $13,184 in Net Profit having invested 829.22 employee hours and 5,659 miles courting and working for Thumbtack Users between my employees and myself.
Comments
-
For transparency, I run a full-service home improvement contracting company servicing southern central Pennsylvania. We are currently three people strong and growing. This is our third calendar year in business.
My first year in business, I spent over $97,000 on the business and I made $2,800. I mention this only to showcase how invested I am in making this successful. Five years ago if you asked me "how would you feel to spend a hundred grand and only get three in return?" I would have cried. This enterprise has become my passion and I was so happy to have a $2,800 return on what would have bought me another rather nice BMW. I am building a legacy, not a business.
I should also mention that I started using the TT for pros app as I would expect most to do. List services, respond to inquiries via the app, the User responds, I work. Customer is happy. I make money. (This will be addressed later as my method changed, and I'll post the results.)
The business is self-financed, so there is no recurring business debt. It is very normal to charge tens of thousands of dollars on a single credit card one month and pay it off the next. All vehicles are owned so the only vehicle costs are insurance, fuel and maintenance. Tools are purchased. Occasionally, equipment is rented. The central location is in my home, so there is no real estate related operating costs.
To eliminate inconsistent action, I am the only one using the Thumbtack app, however, I have been slowly introducing the Customer Care Representative to it's function over the last few weeks. In time, she'll take over all these responsibilities.
So let's get into the data.
First, one needs to know where there's money to be made. This is a subset of a chart that shows which zip codes are making inquiries and which ones buy.

17368 spends a lot of money per Thumbtack inquiry, so it's a great zip code. For this referenced set, any time the purple is near the top of the green area graph, that's a good zip code. 17401 is "just OK." 17402 and 17403 are neighbors with 17401 but for some reason these severely under perform. I dropped them early on. There's not enough data in 17407 or 17370 as they've each only made one inquiry. So I'm letting them ride.
I don't have demographic data to know why 17402 and 17403 are poor performers, but I only need to know they are underperforming and they need to go. Perhaps I need to offer more services in 17368 and 17406 to try to capture more market share in these areas that are clearly spending money.
Next up, you definitely want to experiment with related services to your business and see what works best (I will dig into that in the next post). Here's a graph of the average cost for service based on how the Thumbtack User described it since this is how your business will be found. It does not matter if "fitness equipment assembly" is somehow selected when "electronics repair" should have been. (DerHilfer has been selected to diagnose a circuitry problem and solder in a resistor - I have no idea why.)
Again, this is another subset:

While IRL most of my customers request drywall services, Thumbtack Users like to book our business as a Handyman, and when they do, they buy. Plus it costs less per Inquiry than drywall does. — I like that.
0 -
I know I said I'd get into the related services, but I realized my last post is missing a critical detail - how I've changed my strategy when courting Thumbtack users.
I worked really hard to get my response time down to seconds. Unfortunately, this didn't help me in the "W" column, at least not long term.

At my worst response time, I was taking two hours to respond to Users. That was a difficult month and my win rate reflected that. While initially improving my response time (currently the average is under a minute and has been since November) did appear to improve my win rate, it started trending down again by August.
So I changed my strategy. The end of September, when a User submits an inquiry, I first screenshot the request, this takes about three seconds. If anything changes, I have the most original copy possible. Then I send the user a default reply only taking the time to change the salutation from "Hi," to "Hi, Jim". I then read the inquiry, screenshot it again - the second time you see the Inquiry screen, things are removed like "High Value Job" only appears initially. Between 7:30 A.M and 8:30 P.M. I will click their phone number to dial him. While the phone is ringing, I'm putting what data I have into my CRM.
Next and most important, if he answers, it's not my style, but I'm doing what I need to in order to get ahead, I get his address and do my best to schedule his job. I try to keep him on the phone for about 5 minutes, this gives me time to enter his address into my CRM and also prevents other pros from trying the same.From there, I hope the next Pro hears that he's already been scheduled.
If he does not answer, it's a really good indicator this Inquiry is a loss, but I'll leave a VM anyway. If it's after 8:30 P.M., I call him the next morning at 8:30.
Just today, I ran a report to see when Users are buying and how much it costs per Inquiry on average.

8:00 P.M. for some reason is the most expensive hour of the day, but it returns a 58% win rate, so that's justified, I guess.
8:00 and 9:00 A.M. also have high cost and high return.
However 9:00 P.M. through 7:00 A.M., with the exception of midnight have sub-par response rates. While not shown on the graph, this entire time period including the spike for midnight returns 14% or less on the Win-Loss ratio. Going forward, I will be getting some sleep instead of waking up to reply to TT Users. If it hurts my response time, that's fine.
There are three total jobs that were completed when inquiries came through at midnight. I think a good night's sleep is more important.
1 -
Thanks for sharing, this is super insightful!
2 -
Thank you. There's a lot more where that came from.
When it comes to related services, I think I've tried all the ones my business can justify and even one real oddball that I like a lot.
Here's all the services I've offered via Thumbtack:

I like charts that make it easy to pick out potential performers. There are two green dots that poke above the purple columns. These are "Handyman" and "Furniture Assembly". These are the categories that Users are sending Inquiries to my business. You'll notice the red dots are not far behind, these are when Users buy and become Customers.
There are three other tiny peaks, Interior Painting, Drywall Install, Drywall Repair. Of these five, three return a 1:3 win rate. Painting is 1:8 and is more expensive than 85% of the other categories (purple column), and drywall hanging returned 1:11 in the "W" column, so I dropped them. It was rather disappointing to do that, my company's drywall game is off the hook.
This all hinges on Users accurately describing their problem. I've eliminated the "Handyman" category for this chart, because I think I can explain the Inquiries under that category because Users think I'll be cheaper that way. No, still $93.50/hr. Pretty middle of the road for this area for Home Improvement Services.

I've been hired as an "Interior Painter" to hang a chandelier for one customer and remove shutters for another. I have no idea how to fix this. Since I dropped "Interior Painting", it's kind of moot. But it happens a quarter of the time.
I have no idea why I turned on "BBQ Grill", I guess I figured if putting someone's desk together gets me an opportunity to introduce my company, it's not much different than putting a grill together.
This category has a perfect track record:

It was an accurate description, it was only $5, the customer bought, hired us to come back a week later to replace a wall lamp and (not pictured on this graph) returned a 40% margin on the grill which is amazing since it required two trips.
I hope to see more BBQ grill services this year.
2 -
This is a boring transparency post. Sorry.
There are 10 datapoints I'm using to make this analysis:
Inquiry Initiated Date/Time
Zip Code
Category Requested
Actual Category Serviced. Note: "Inaccuracy" stated above is rather loose. If the user selected Interior Painting and he needs exterior painting, that's close enough and not counted as an inaccuracy.
Number of Pros Contacted/Responded & my response time
Thumbtack Fee
As part of my ordinary business practices, the following points are also utilized, but not collected from TT:
Revenues
Expenditures
Miles Driven
Hours Consumed (travel & labor)Since I sell a service, not really goods, I can't use the traditional Cost of Goods Sold for a margin.
I am using this formula instead:
(Gross Revenue -(Thumbtack Fees + Materials Costs + Mileage Reimbursement)
)
/ Gross Revenue.
I'm sure somewhere in GAAP (Generally Accepted Accounting Principles) there's a better description with this same calculation. I'm not an accountant.Miles Reimbursement is based on the IRS guidelines. Most of my data is at $0.67/mi. 2023 was 0.65 and 2025 is at 0.70. These all transfer in to the formulas based on the date of travel.
Also, I'm going to apologize in advance as I know I'm going to mis-use a term that was exceptionally common in an industry in which I used to work. I know somewhere I'm going to say "Cost to Serve" when I mean "Cost per Appointment". I know these metrics are different and I haven't broken that habit.
Cost to Serve is the cost of actual business activities and overhead costs.
This is incorrect for this analysis because what I paid for insurance in May vs. June (my insurance tripled as I upgraded my policy to handle larger rental equipment risk) has no relevance to this thread.Cost per Appointment is more granular. If I get 30 TT inquiries at $30 average and I make 10 appointments, my Cost per Appointment is (30 * 30) / 10 = $90.
If a month generates no appointments, the chart will show the total cost of Thumbtack fees instead.I apologize in advance for this confusion. If I say "Cost to Serve", I mean "Cost per Appointment".
Finally, we hit the $5,000 mark in January, but my graphs are from live data, so everything up to the time of the related post is included. It's far too time consuming to remove data for the purpose of this thread.
0 -
I realized yesterday that the "Handyman" category needs an honorable mention, specifically because it requires an extremely broad array of skills to the point where I understand why I see often I'm the only one to respond to a User.
Only 10% of the time do all the selected Pros respond. 1/3rd of the time, I am the only one to respond to this category.
And here's the chart that probably explains why. This is the actual User's need when he selected 'Handyman' and as you can see, 5% of the time, even I can't help him. Like yesterday, when someone contacted 3 of us to replace a plate glass window that's seven and a half feet wide and 10 feet tall installed in likely the 1940s. I was the only one to respond. I actually went to the location solely because I didn't quite believe the report of "a bullet hole" in the location.
If you're gonna play the "Handyman" game, you better have a very wide variety of tools and skills.

These were significant inaccuracies too, like remove and re-frame an entire wall, cut a channel in the concrete floor to run plumbing for an island and install a dishwasher. All in the same job. We didn't get it because the person doesn't understand licensing in his area. There are no licensing authority in his area and thus, no licenses. I know whomever did get the job simply lied to the home owner. That's not the way I conduct business.
The "Non-offered service" according to my notes are:
Roofing - not refunded, Tile work - not refunded, Commercial Pneumatic System Service (Thumbtack eventually listed this as "suspicious" - not refunded), Commercial Refrigeration Line Service (Also marked suspicious, not refunded), Masonry: refunded, Foundational Work refunded, and "Glass shop" (refund will be requested) mentioned above,
I have completed 50, consuming 461.36 employee hours courting and working Users in this category. My gross revenue is $17,832.83, gross expenditures $5,339.92 including Thumbtack fees of $2,535.95 ($50.72/appointment) , $3,289.80 mileage reimbursement.
This accounted for the majority of the Thumbtack spending.
0 -
December was one of the best months on TT, with a 57% win rate across all of my offerings. It was also a rare time when I let TT turned on for the entire month, so I decided to try the same in January and February: Normally, I turn TT on for a few days and off for several weeks because the calendaring function doesn't work right allowing Users to request service on days my business is "blocked off", "closed" and even on the same day as late as 11:42 P.M. So the only thing I can do is turn it off entirely to prevent Users from making Inquiries I can't possibly service.

1Q25 didn't work out so great even though there were no changes to my profile or habits. For February, the win rate is now 23% and all of February's Inquiries have been completed.
By the way, "Replace a massive pane glass window as a 'Handyman'" refund request was denied.
I've figured out the secret to preferences. If the User selects a category that you've offered services, it's the Pro's fault regardless if the requested task is no where in the skillset of that category. As such, if someone selects an Interior Painter to hang a chandelier, it "falls within the job preferences you've set in your account." All you painters out there better learn how to hang crystal.
Here's the track record for Handyman over time.

And here's the margins & costs over time:

Now to be fair, the month of March is only six days in and hasn't had time to even start to precipitate. However, I made the most recent set of changes March 1 and have only had one Inquiry, the pane of glass one and obviously, no sales.
I'm making one more change to Handyman. I'm turning it off for now, maybe permanently.
The margins have fallen from 69% in May to 24% in February, The changes I made March 1 should have brought those margins back up again, probably not to 69%, but I would have hoped at least 40%.
The fees are going up, the margins have been trending down for months, it's time to find something different.
0 -
Since I just described how I killed the handyman, I might as well offer how Drywall and Painting failed to thrive.

Drywall when I win, is actually a good deal. The problem is the win rate is far too low. Since this category is my bread and butter, you would think it would be a slam dunk. With most months showing total losses wasting about $70 each month, I decided to turn the cost per inquiry down really low and take my chances one last time. There are simply other contractors out there willing to risk more, so Thumbtack won't show my business to Users. Which I'm OK with.
Same goes for Drywall Hanging:

$85 cost per appointment and most months again showing $55/month losses in Thumbtack fees, I turned it way down to try one last time. But Thumbtack isn't showing my business to Users, so no opportunities, which also means no losses.
And that brings me to Interior Painting:

Interior Painting started off as a massive looser and is the reason the scale on the Costs and Wins axis is so broad, because the first month I lost $200 on Thumbtack fees and by the time I got it dialed in where the win rate started going up, it wasn't worth it any more. Even at $27 per appointment cost, the number of wins vs. inquiries just isn't there and the margins are too low.

In order to make it work, I had to take a 38% loss? It makes sense not to do it at all. FWIW, I have a $3,000 two bath paint & kitchen back splash job starting on Thursday that should return a margin of about 35% when it's finished. These categories work elsewhere, just not here.
0 -
When we first started using Thumbtack, I used the app as I expected most people do. An Inquiry comes in from a User, message him back, wait. Some bite, some don't.
And the result of that was out of 175 Inquiries, 76 had no further activity and 24 didn't read the message. It was exceptionally frustrating to see almost half of all the money Thumbtack charges me go to waste. I finally had my breaking point September 30th, 2024, with the realization that 68% of all Thumbtack Inquiries have no value.
(Chart Represents Inquiries earlier than Sept. 30):

After that, I abandoned the Thumbtack Message as the source of interaction and went straight to the phone (after sending a brief message that I would be calling the user shortly, to ensure my response was noted by Thumbtack.)
This worked great through December, 2024. Out of 24 Inquiries, only 4 were uncontacted. This is a decrease from 43% unresponsive Inquiries to 16%. In December, my win rate was 57%, the highest ever on Thumbtack.
However, it didn't last long. 2025 YTD, out of 60 Inquiries, 18 are uncontacted, 4 did not read the message on Thumbtack. This is 30% of all Inquiries with zero contact meaning no hope of any sales.
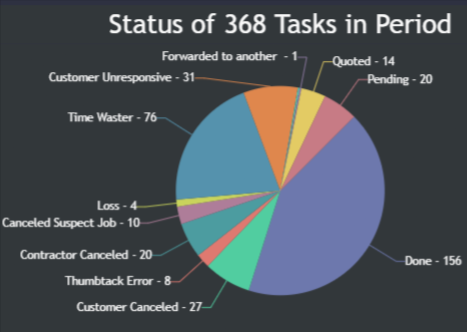
Across all time, this is what the status of Inquiries looks like for DerHilfer:

Note: "Postponed", "Pending", "Quoted" essentially mean "abandoned". I have zero expectation that these will be converted to sales. To the best of my recollection, only one Inquiry was converted if it was not completed within a month.
"Thumbtack Error" is when the app didn't notify me. When discovered, these were massively stressful as I invested dozens of hours tracking these Inquiries down. Eventually I found them in my email, but I had to search for Last Name First Initial, which is not how they're listed on Thumbtack bills.
"Time Waster" is someone who doesn't understand the scope of his desires or has no ability to pay. Thumbtack introduced me to a very nice gentleman who wanted to remodel his derelict 1973 trailer in a mobile home park and what he wanted to do would cost more than building a new house. He is on disability and his geriatric mother lives with him. She has no assets either.
If I include derivative tasks, where a customer asks about additional work it gets slightly better:
Which lead me to treat Thumbtack as a Loss Leader marketing strategy. I'll discuss this more in a future post.
0 -
In February, I hired a Customer Care Assistant. Her job is to compliment my skillset and handle some of the things that I'm just plain bad at. Like follow-up on work performed.
I'm pleased to announce, the DerHilfer Customer Care Assistant has been a remarkable success! While this doesn't apply specifically to Thumbtack, but business in general, I want to mention that a post-work check in makes a world of difference. Her average is 33.9% of people answer the phone. If no answer, she leaves a VM. Some customers call back. If no answer, two days later, she tries again before abandoning the attempt.
While chatting with the customer, she asks for a scale of 1-5 rating on our work. If the customer says "five", she asks them to write a review. Most agree. She sends them a text message with the review link.This has virtually doubled our reviews and it gives the one person who said "four" a chance to make his opinion known without harming the publicly available 5.0 star-rating on Google, NextDoor, Thumbtack, etc.
Also, worth noting, that solitary less than satisfied customer runs a roach filled slum, took two months to pay and we will never work for him again. She called him because I marked him as "Bad Credit" instead of "Do Not Service" in our CRM. My fault, not hers.She has also booked about $1,000 of additional work to date, which isn't earth shattering, but that's $1,000 of business that's not going to my competitors and demonstrates her value to my company.
This has been so effective, I'm actually offering her services to my counterparts and sub-contractors I know personally in the area as an additional revenue stream for my business. Still working out the details. When I have a thousand rows of data, I'll post pretty charts like before. Right now, I just have a matrix, something like "March 20: 10 calls, 6 no answer, 1 requested call-back, 3 reviews requested, AVG: 5.0 stars"
Excited to share this news.
1

Resources
- All Categories
- 13 Link your Thumbtack account with partner platforms
- Pro Mentorship
- 35 Comunidad en Español
- 1 Featured Events
- 15 On-Demand Webinars
- 207 Network and Collaborate
- 121 Thumbtack Pro Rewards
- 1.1K Business Resources
- 201 Inspiration
- 73 Business Resilience
- 317 Thumbtack Resources
- 323 Community News
Welcome! Check out our Community Code of Conduct. (review here)